Security Visibility Dashboard using CloudWatch Unified Data Store
Amazon CloudWatch Unified Data Store provides a centralized way to discover, organize, and query your log data across AWS services without needing to know individual log group names. To make this possible, CloudWatch Unified Data Store uses facets — fields in your log data that CloudWatch surfaces for interactive filtering, grouping, and analysis. Default facets like @data_source_name, @data_source_type, and @data_format are automatically available on all Standard log class log groups with no configuration required. In the CloudWatch Logs Insights console, you can select facet values to explore your data visually, or reference them within your queries to efficiently narrow the search scope to only the log groups and events that match.
Through these facets, CloudWatch automatically categorizes logs by their originating data source — such as AWS CloudTrail and Amazon VPC Flow Logs — so you can query all your CloudTrail or VPC Flow Log log data across your log groups using the @data_source_name facet, regardless of how many log groups exist or what they're named.
With CloudWatch Cross-account cross-Region log centralization, you can build security analytics on top of that foundation. This guide walks through deploying a sample pre-built CloudWatch Dashboard via AWS CloudFormation that leverages CloudWatch data sources to provide near real-time visibility into your CloudTrail and VPC Flow Logs activity. It explains what each widget provides and describes how to use the dashboard for security monitoring, incident investigation, and compliance visibility.
Why This Dashboard Matters
Security teams need centralized, near real-time visibility into API activity and network traffic across their AWS accounts. Without a centralized dashboard, teams must manually run queries across multiple log groups, correlate data between CloudTrail and VPC Flow Logs, and piece together security context from disparate sources.
This dashboard addresses several key challenges:
- No dependency on log group names: Uses
SOURCE logGroups() | filterIndex @data_source_nameto dynamically discover CloudTrail and VPC Flow Logs through CloudWatch Unified Data Store default facets, regardless of what the log groups are named in your account. - Dual format support: Deploys either a Standard (native AWS field names) or OCSF (Open Cybersecurity Schema Framework) version of the dashboard based on your log format preference.
- Cross-service correlation: Places CloudTrail API activity and VPC Flow Log network data side by side for visual correlation of security events.
- Portable across accounts: The same CloudFormation template works in any account that has CloudTrail and VPC Flow Logs flowing to CloudWatch Logs, with no parameter changes needed for log group names.
Prerequisites
Before deploying, verify that your account has the required data sources available:
aws logs list-aggregate-log-group-summaries --group-by DATA_SOURCE_NAME_AND_TYPE
You should see entries for aws_cloudtrail and amazon_vpc in the output. If these are missing, ensure that:
- CloudTrail is configured to deliver logs to a CloudWatch Logs.
- VPC Flow Logs are configured to deliver to CloudWatch Logs for at least one VPC.
Deploy the Dashboard
- Download the CloudWatch_Dashboard_CloudTrail_VPC.yaml template.
- Navigate to CloudFormation → Create stack → With new resources.
- Upload the
CloudWatch_Dashboard_CloudTrail_VPC.yamltemplate. - Configure the parameters:
- DashboardName: A name for your dashboard (default:
CloudTrail-VPC-Dashboard). - LogFormat: Choose
Standardfor native AWS CloudTrail/VPC Flow Log field names, orOCSFfor Open Cybersecurity Schema Framework normalized fields.
- DashboardName: A name for your dashboard (default:
- Review and create the stack.
CloudFormation Parameters
| Parameter | Default | Description |
|---|---|---|
DashboardName | CloudTrail-VPC-Dashboard | Name for the CloudWatch dashboard |
LogFormat | Standard | Standard (native AWS fields) or OCSF (normalized schema) |
How the Queries Work
Every CloudWatch Logs Insights query in this dashboard uses the same pattern:
SOURCE logGroups() | filterIndex @data_source_name in ["aws_cloudtrail"]
| <your query logic here>
SOURCE logGroups()tells CloudWatch to search across all log groups in the account.filterIndex @data_source_name in [...]uses the@data_source_namedefault facet to narrow the search to only log groups containing the specified data source. CloudWatch automatically provides this as a default facet on all Standard log class log groups — no custom configuration needed.- For CloudTrail queries, the data source name is
aws_cloudtrail. - For VPC Flow Log queries, the data source name is
amazon_vpc.
This approach means you never need to know or configure the actual log group name. The dashboard works identically whether your CloudTrail log group is named aws-cloudtrail-logs, aws/cloudtrail/managementevents, or any custom name.
Security Best Practices
Restricting Dashboard Access with IAM
As a best practice, apply least-privilege access controls to any CloudWatch dashboard that surfaces security data.
Below is an example IAM policy that grants read-only access to the dashboard and denies modification. Attach it to the IAM roles or groups that should have view-only access:
{
  "Version": "2012-10-17",
  "Statement": [
    {
      "Sid": "AllowDashboardReadOnly",
      "Effect": "Allow",
      "Action": [
        "cloudwatch:GetDashboard",
        "cloudwatch:ListDashboards"
      ],
      "Resource": "arn:aws:cloudwatch::ACCOUNT_ID:dashboard/CloudTrail-VPC-Dashboard"
    },
    {
      "Sid": "DenyDashboardModification",
      "Effect": "Deny",
      "Action": [
        "cloudwatch:PutDashboard",
        "cloudwatch:DeleteDashboards"
      ],
      "Resource": "arn:aws:cloudwatch::ACCOUNT_ID:dashboard/CloudTrail-VPC-Dashboard"
    }
  ]
}
Replace ACCOUNT_ID with your AWS account ID and CloudTrail-VPC-Dashboard with your actual dashboard name if you customized it.
For the security operations team that needs to maintain the dashboard, use a separate policy that allows both read and write:
{
  "Version": "2012-10-17",
  "Statement": [
    {
      "Sid": "AllowDashboardFullAccess",
      "Effect": "Allow",
      "Action": [
        "cloudwatch:GetDashboard",
        "cloudwatch:ListDashboards",
        "cloudwatch:PutDashboard",
        "cloudwatch:DeleteDashboards"
      ],
      "Resource": "arn:aws:cloudwatch::ACCOUNT_ID:dashboard/CloudTrail-VPC-Dashboard"
    }
  ]
}
The dashboard queries also require logs:StartQuery, logs:GetQueryResults, and logs:FilterLogEvents permissions on the relevant log groups. Ensure that the IAM roles have these permissions scoped to the CloudTrail and VPC Flow Log log groups.
Complementing the Dashboard with CloudWatch Alarms
The dashboard shows you what's happening but won't notify you when something goes wrong. To get alerted on critical security events, set up CloudWatch Alarms backed by CloudWatch Logs metric filters. Here are some worth considering:
| Event | Metric Filter Pattern |
|---|---|
| Root account usage | { $.userIdentity.type = "Root" && $.userIdentity.invokedBy NOT EXISTS && $.eventType != "AwsServiceEvent" } |
| Privilege escalation | { ($.eventName = "AttachRolePolicy") || ($.eventName = "PutRolePolicy") || ($.eventName = "CreateAccessKey") || ($.eventName = "CreateLoginProfile") } |
| Console login failures | { ($.eventName = "ConsoleLogin") && ($.errorMessage = "Failed authentication") } |
Use a CloudWatch Logs Insights query-based alarm on REJECT count over a rolling window. | Detects port scanning or active network attacks. |
Route alarm actions to an SNS topic that notifies your security operations team via email, Slack, or your incident management platform.
Log Group Encryption and Retention
CloudWatch Logs encrypts all log data at rest by default using AWS-managed keys — no configuration needed. However, if your organization requires customer-managed encryption keys for compliance, you can associate a KMS key with each log group. This gives you full control over key rotation, access policies, and audit trails via CloudTrail.
This template creates only the dashboard — it does not create or manage the underlying log groups, so it cannot enforce encryption or retention settings on them. Make sure the CloudTrail and VPC Flow Log log groups for the dashboard have appropriate settings applied:
- KMS encryption: If required, associate a KMS key with the log group using
aws logs associate-kms-keyor via CloudFormation when creating the log group. - Retention policy: By default, CloudWatch Logs retains log data indefinitely. Set a retention policy that balances your compliance requirements with cost.
Additional Recommendations
- Enable CloudFormation stack termination protection after deployment to prevent accidental deletion.
- Use Service Control Policies (SCPs) in AWS Organizations to restrict
cloudwatch:PutDashboardandcloudwatch:DeleteDashboardsto specific admin roles across all accounts. - Enable CloudTrail logging for CloudWatch API calls so that any dashboard modifications are auditable via the
PutDashboardevent in CloudTrail.
Dashboard Sections and Widget Reference
The dashboard is organized into six sections. Below is the Standard format version — the OCSF version has equivalent widgets using OCSF field names (api.operation, src_endpoint.ip, actor.user.name, etc.).
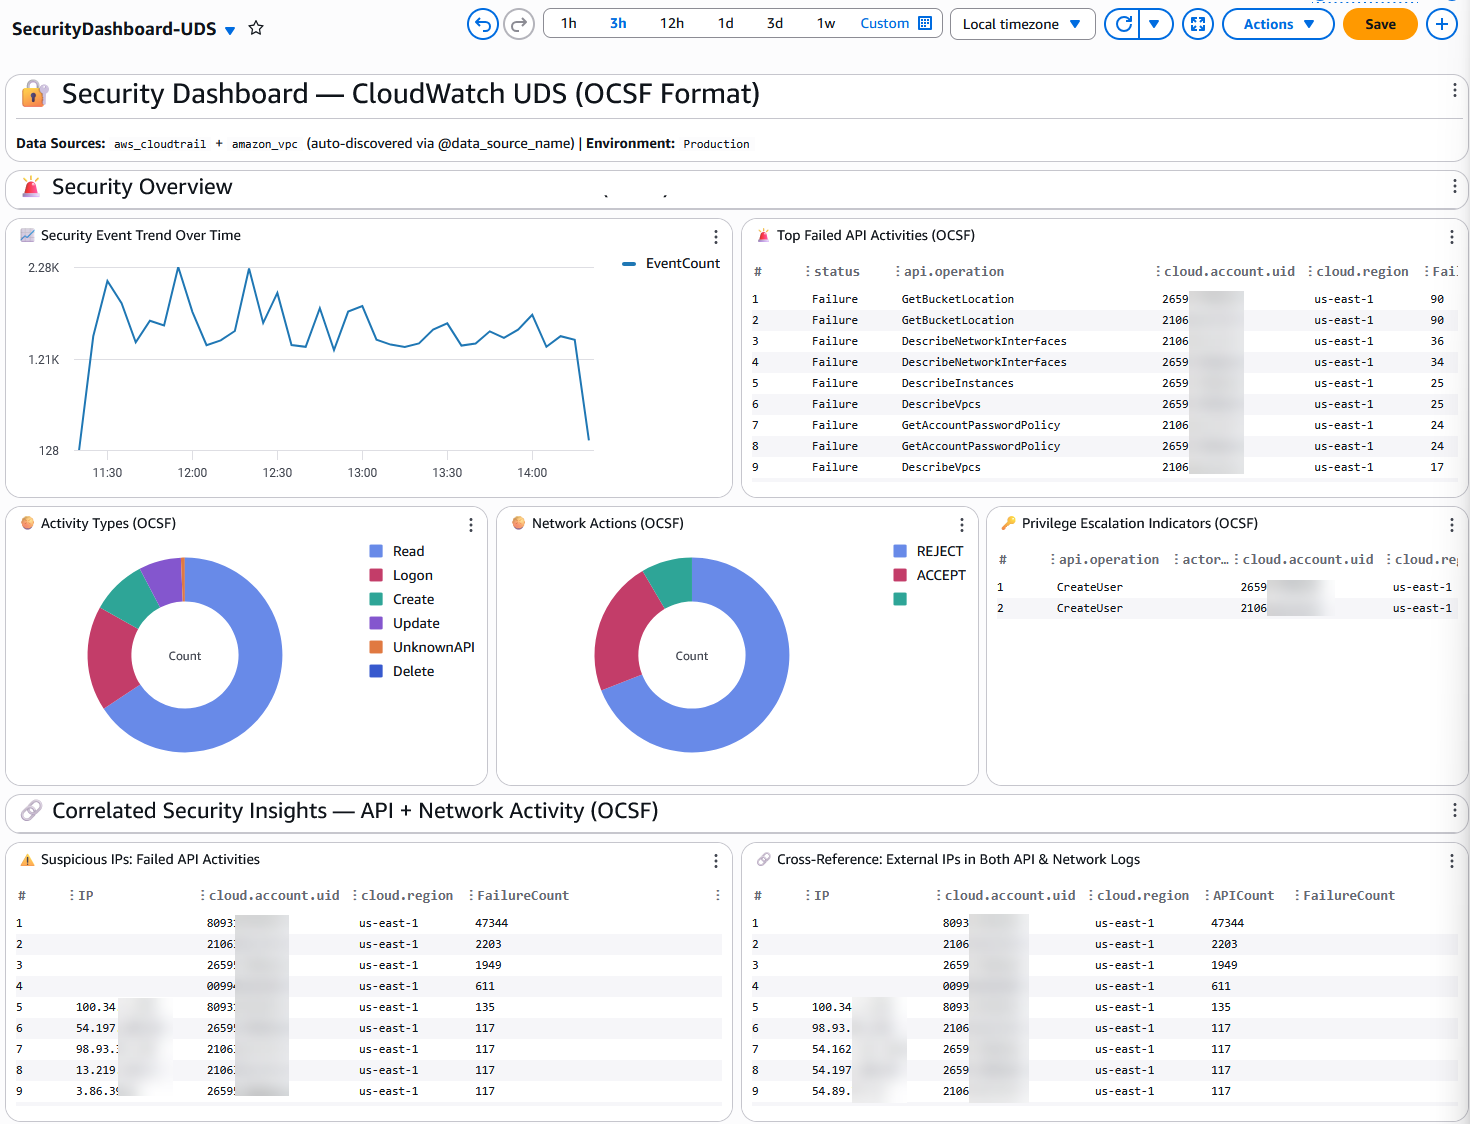
Section 1: Security Overview
This section provides an at-a-glance view of security posture across your AWS environment.
| Widget | Type | Data Source | What It Shows | Why It Matters |
|---|---|---|---|---|
| 📈 Error Rate Trend Over Time | Time series | CloudTrail | Count of API errors aggregated in 5-minute bins over time. | A sudden spike in errors can indicate brute-force attacks, misconfigured automation, or compromised credentials. Use this as your first indicator that something unusual is happening. |
| 🚨 Top Error Codes (Unauthorized / Access Denied) | Table | CloudTrail | Most frequent access-denied and unauthorized error codes, broken down by error code, API event name, account, and region. | Identifies which specific API calls are being denied and in which accounts. Patterns here can reveal credential stuffing, permission misconfigurations, or lateral movement attempts. |
| 🥧 User Identity Types | Pie chart | CloudTrail | Distribution of API calls by identity type (IAMUser, AssumedRole, Root, FederatedUser, AWSService, etc.). | A healthy environment should show mostly AssumedRole and AWSService calls. Significant Root or IAMUser activity may warrant investigation. |
| 🥧 VPC Flow Actions | Pie chart | VPC Flow Logs | Ratio of ACCEPT vs REJECT actions across all VPC flow log records. | A high REJECT ratio can indicate port scanning, misconfigured security groups, or active attack attempts against your network perimeter. |
| 🔐 Root Account Activity | Table | CloudTrail | Recent API calls made using the root account, including event name, source IP, account, and region. | Root account usage should be rare and well-justified. Any unexpected root activity is a high-priority security event that should be investigated immediately. |
Section 2: Correlated Security Insights — CloudTrail + VPC Flow Logs
This section places API-layer and network-layer security data side by side for visual correlation.
| Widget | Type | Data Source | What It Shows | Why It Matters |
|---|---|---|---|---|
| ⚠️ Suspicious IPs: API Errors | Table | CloudTrail | External (non-RFC1918) IP addresses generating the most API errors, grouped by account and region. | External IPs with high error counts are likely attempting unauthorized access. Cross-reference these with the network REJECT widget to see if the same IPs are also being blocked at the network layer. |
| ⚠️ IPs with Network REJECT | Table | VPC Flow Logs | External IP addresses with the most REJECT actions, broken down by destination port. | Shows which external IPs are being blocked by security groups or NACLs. When the same IP appears in both this widget and the API Errors widget, it strongly suggests malicious activity. |
| 🔗 Cross-Reference: External IPs in CloudTrail Logs | Table (full width) | CloudTrail | All external IPs making API calls, with total API call count and error count per IP, account, and region. | Provides a comprehensive view of external IP activity. IPs with high API counts but low error counts may be legitimate services; IPs with high error ratios warrant investigation. |
| 📈 API Activity Timeline | Time series | CloudTrail | Total API call volume over time in 10-minute bins. | Establishes a baseline of normal API activity. Deviations from the baseline can indicate automated attacks, service disruptions, or compromised credentials running scripts. |
| 📈 Network Traffic Timeline | Time series (stacked) | VPC Flow Logs | Network flow count over time, stacked by ACCEPT/REJECT action. | Visualizes network traffic patterns and the proportion of blocked traffic over time. A growing REJECT trend may indicate an ongoing attack. |
Section 3: Network Security — Network Activity Analysis
Deep dive into VPC Flow Log data for network-layer security visibility.
| Widget | Type | Data Source | What It Shows | Why It Matters |
|---|---|---|---|---|
| 🚫 Top Blocked Network Connections | Table | VPC Flow Logs | Source/destination IP pairs with the most REJECT actions and total bytes transferred. | Identifies the most persistent blocked connection attempts. High-volume blocked connections from a single source IP may indicate a targeted attack or misconfigured application. |
| 📊 Top Destination Ports | Bar chart | VPC Flow Logs | Most frequently targeted destination ports across all flow log records. | Common ports like 443 (HTTPS) and 80 (HTTP) are expected. Unusual ports (e.g., 22, 3389, 445) receiving high traffic may indicate scanning or exploitation attempts. |
| 📉 Network Traffic Bytes Over Time | Time series (stacked) | VPC Flow Logs | Total bytes transferred over time, stacked by ACCEPT/REJECT. | Tracks data transfer volume trends. Sudden increases in accepted bytes could indicate data exfiltration; increases in rejected bytes suggest active blocking of malicious traffic. |
| 🔍 Top External Source IPs | Table | VPC Flow Logs | External IPs with the most connections and total bytes, grouped by action (ACCEPT/REJECT). | Identifies the most active external IPs communicating with your VPCs. Useful for identifying legitimate partners, CDNs, or potential threat actors. |
Section 4: Identity & Access Management
Focused on IAM activity and authentication events from CloudTrail.
| Widget | Type | Data Source | What It Shows | Why It Matters |
|---|---|---|---|---|
| 🔑 IAM Privilege Escalation Indicators | Table | CloudTrail | High-risk IAM API calls (CreateUser, AttachUserPolicy, AttachRolePolicy, PutUserPolicy, PutRolePolicy, CreateAccessKey, CreateLoginProfile) grouped by event name, user ARN, account, and region. | These API calls can grant elevated permissions. Unexpected occurrences may indicate an attacker establishing persistence or escalating privileges after initial compromise. |
| 📊 Top API Calls | Bar chart | CloudTrail | The 10 most frequently called APIs across all CloudTrail events. | Establishes what "normal" API activity looks like. Unusual APIs appearing in the top 10 may indicate new automation, misconfiguration, or malicious activity. |
| 🛡️ Authentication Events | Table | CloudTrail | AWS Console login attempts, grouped by success/failure (errorCode), user ARN, account, and region. | Failed console logins can indicate credential stuffing or brute-force attacks. Successful logins from unexpected users or regions should be investigated. |
| 📈 Authentication Attempts Over Time | Time series (stacked) | CloudTrail | Console login attempts over time in 30-minute bins, stacked by success/failure. | Visualizes authentication patterns. A burst of failed logins followed by a success may indicate a compromised account. |
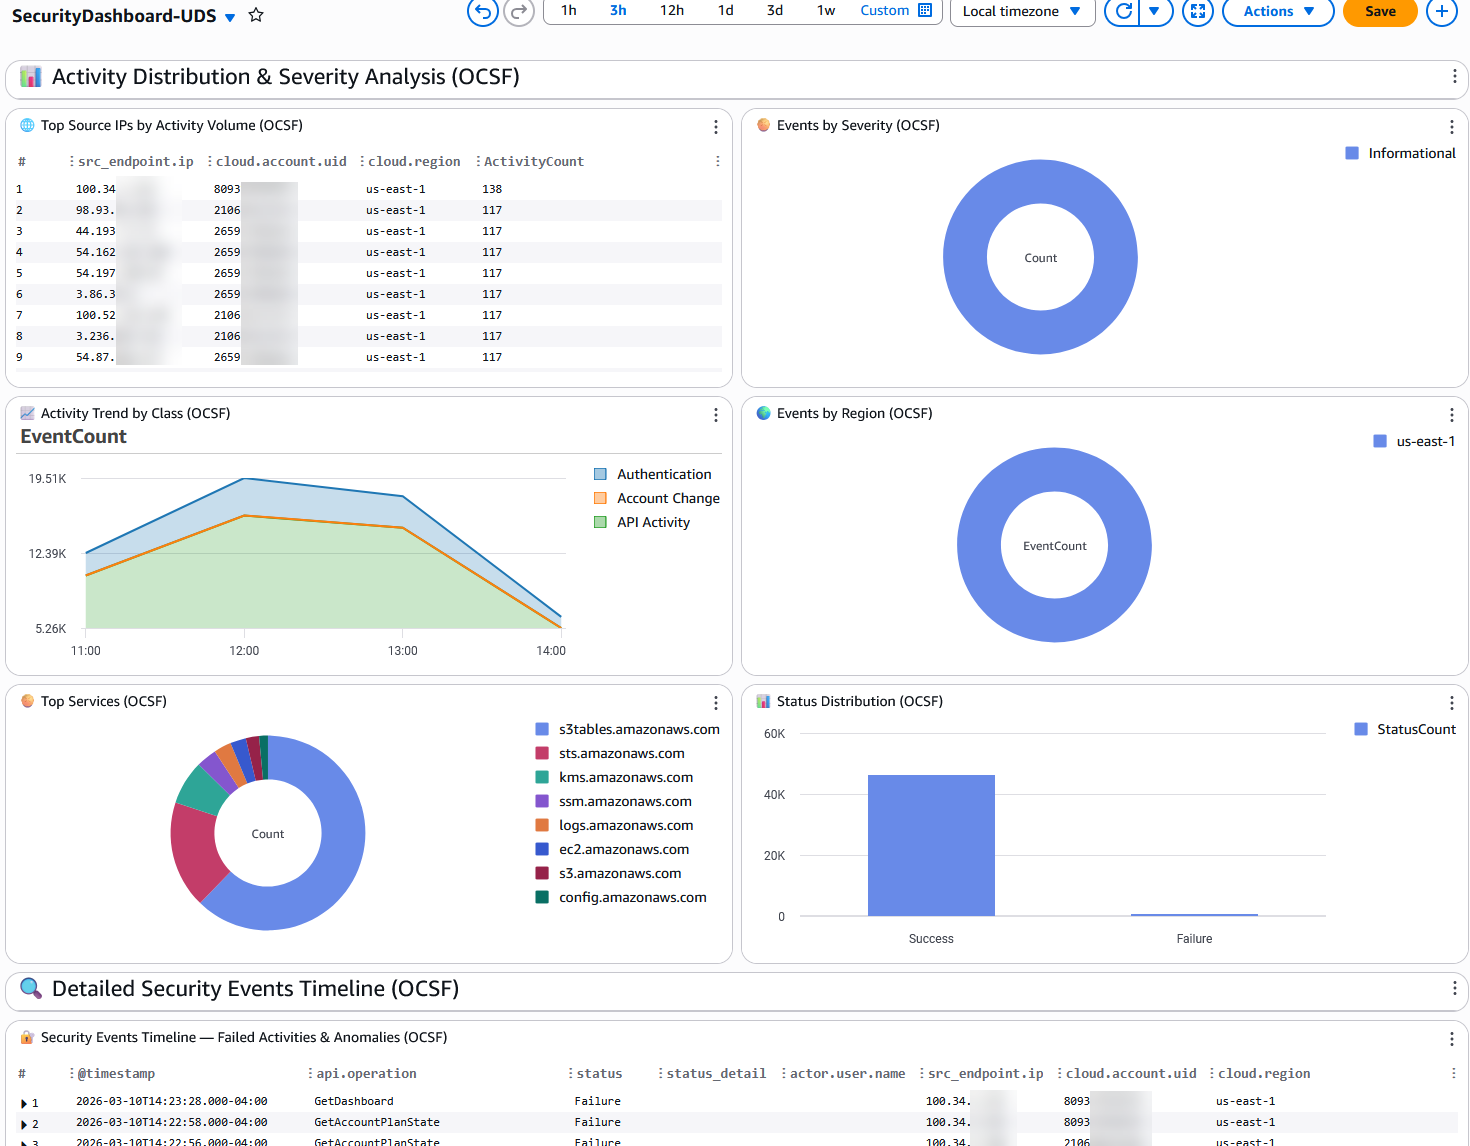
Section 5: Activity Distribution & Analysis
Broader analysis of API activity patterns for operational and security awareness.
| Widget | Type | Data Source | What It Shows | Why It Matters |
|---|---|---|---|---|
| 🌐 Top Source IPs by Activity Volume | Table | CloudTrail | External IPs generating the most API activity, grouped by account and region. | Identifies the most active external callers. Unexpected IPs with high activity volumes may indicate compromised credentials being used from external infrastructure. |
| 🥧 Events by Event Type | Pie chart | CloudTrail | Distribution of CloudTrail event types (AwsApiCall, AwsConsoleSignIn, AwsServiceEvent, etc.). | Provides context on the nature of activity. A sudden increase in AwsConsoleSignIn events or a new event type appearing may warrant attention. |
| 📈 Activity Trend by Event Source | Time series (stacked) | CloudTrail | API call volume over time, broken down by AWS service (eventSource). | Shows which services are most active and how activity patterns change over time. A service that suddenly becomes very active may indicate automated actions or an incident. |
| 🌍 Events by Region | Pie chart | CloudTrail | Distribution of API calls across AWS regions. | Activity in unexpected regions can indicate an attacker operating from a region where you don't normally have resources. This is a common indicator of compromise. |
| 🥧 Top Services | Pie chart | CloudTrail | The most called AWS services by event count. | Establishes your service usage baseline. New services appearing or unusual proportions may indicate unauthorized resource creation. |
| 📊 Read vs Write API Calls | Bar chart | CloudTrail | Ratio of read-only vs mutating (write) API calls. | A healthy environment typically has more read calls than write calls. A sudden increase in write calls may indicate bulk resource creation, modification, or deletion — potentially malicious. |
Section 6: Detailed Security Events Timeline
| Widget | Type | Data Source | What It Shows | Why It Matters |
|---|---|---|---|---|
| 🔐 Security Events Timeline — Errors & Access Denied | Table (full width) | CloudTrail | The 100 most recent API errors with full context: timestamp, event name, error code, error message, user ARN, source IP, account, and region. | This is your investigation starting point. When an alert fires or you notice anomalies in the widgets above, come here to see the raw events with full context for incident response. |
Clean Up
To remove the dashboard and all associated resources:
aws cloudformation delete-stack --stack-name CloudTrail-VPC-Dashboard
Replace CloudTrail-VPC-Dashboard with the name of the CloudFormation stack that was used in the Deploy section
Conclusion
This CloudWatch Dashboard provides centralized, near real-time security visibility across CloudTrail API activity and VPC Flow Log network data using CloudWatch Unified Data Store data sources. By leveraging the @data_source_name default facet, the dashboard automatically discovers the right log groups without requiring log group name configuration, making it portable across any AWS account. Deploy it via CloudFormation in minutes to gain immediate security visibility for threat detection, incident investigation, and compliance monitoring.